This paper examines the provision of official flood risk information in the United States and its distributional impacts on residential flood insurance take-up. Assembling all flood maps produced after Hurricane Katrina, I document that updated maps decreased the number of properties zoned in high-risk floodplains and incorrectly omitted five million properties, primarily in neighborhoods with more Black and Hispanic residents. Leveraging the staggered timing of map updates, I estimate they decreased flood insurance take-up and exacerbated racial disparities in insurance coverage. Correcting flood maps could increase welfare by $20 billion annually, but past map updates distorted risk and price signals.
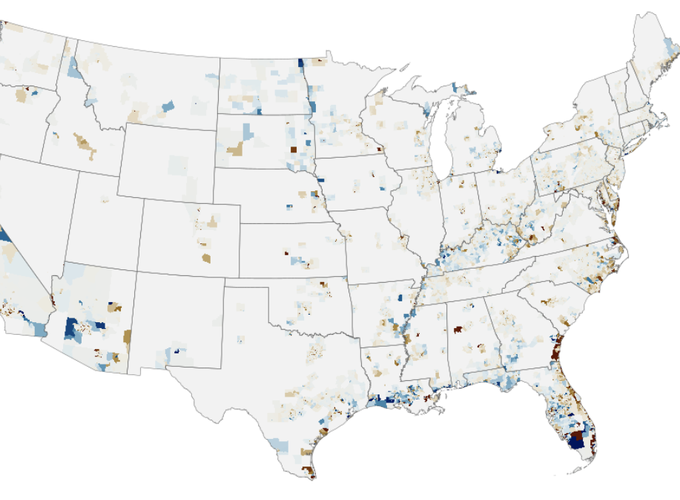 Figure by Joakim A. Weill